All-in-One
The Employee Lifecycle
All in One Place
From hiring to payroll, connect employee data seamlessly across your organization to maximize efficiency and minimize double entry.
8,134 + reviews
All in One Place
From hiring to payroll, connect employee data seamlessly across your organization to maximize efficiency and minimize double entry.
8,134 + reviews

Trusted by over 10,000 businesses


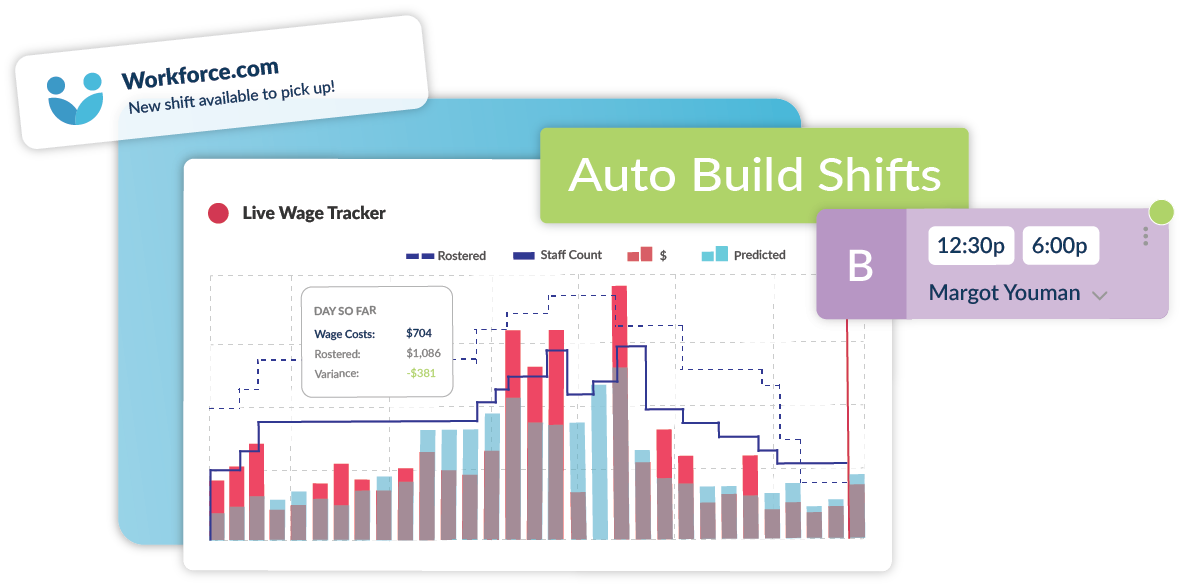
Scheduling
Flexible scheduling driven by AI. Forecast your staffing needs, build schedules efficiently, and react to last-minute changes to cut down on overtime and understaffing.
Click below for a demo
Labor Forecasting
Building Schedules
Shift Swapping
Communications
Human Resources
A single source of truth for employee records. Hire staff and seamlessly onboard them to payroll, eliminating data reentry and freeing up time for performance reviews and engagement initiatives.
Click below for a demo
Hiring
Onboarding
HRIS & Documents
Performance
Management

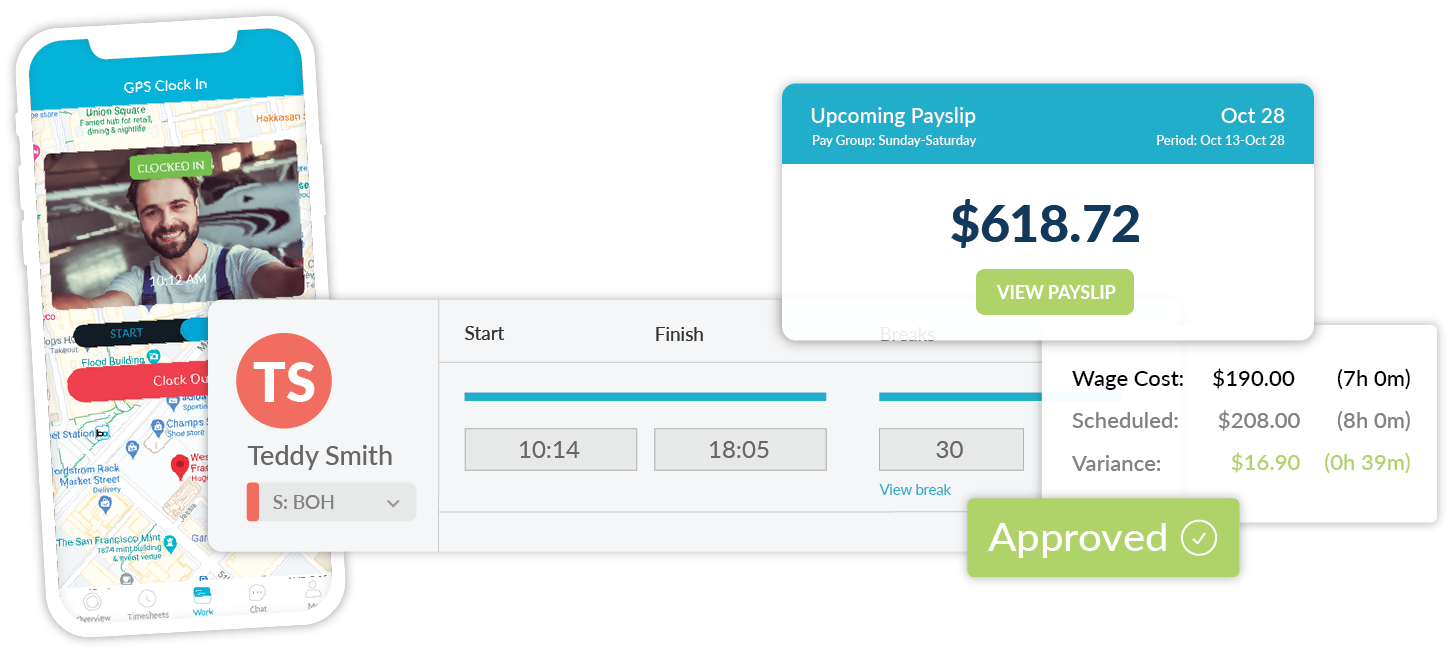
Payroll
Proactive automation for faster pay runs. Daily timesheet approvals, employee portals, and robust wage and tax calculations eliminate common payroll processing bottlenecks.
Click below for a demo
Time & Attendance
Timesheet Approvals
Employee
Self-Service
Payroll Processing